-
Digital and Analytics
We have developed distinctive capabilities in digital advisory and data analytics that are key to the success of dynamic organisations.
-
Business Consulting
Our business consulting services help organisations improve operational performance and productivity throughout the growth life cycle.
-
Corporate Finance & Restructuring
We combine our insights and experience to provide a comprehensive range of advisory and corporate finance and restructuring solutions.
-
Internal Audit
Our internal audit service is designed to provide both assurance and consulting assistance on the adequacy and effectiveness of an organisation’s system of internal controls.
-
Business Risk Services
Our service is focused on enabling broader risk coverage and proactive management of risks for the achievement of organisational strategy.
-
Business Process Solutions
We work with a multitude of organizations to improve their finance function efficiency, reduce costs associated with business processes and provide a complete solution to the challenge faced by South African organizations.
-
Programme Assurance & Advisory
Our aim is to protect shareholder value by providing Assurance and Advisory services on change portfolios and large-scale programmes to assist organisations.
-
Forensic Services
Our forensic capability is integrated with our wider advisory services – not an add-on.
-
Cyber Advisory
Our Cyber Advisory service is designed to help you identify, protect, detect, respond and recover from cyber-attacks.
-
IT Advisory Services
We help clients to navigate the complexities and provide you with robust independent assurance that your IT risks, key management priorities and core systems are being appropriately managed.
-
SNG ARGEN
We have a dynamic actuarial team set to assist businesses to comply with the audit standards where actuarial services are required.
-
General Audit
We provide a sound statutory audit of financial statements specialising in both listed entities and state-owned organisations.
-
Financial Services Group (FSG)
The Financial Services Group (FSG) offers specialised audit and advisory solutions to the banking, treasury and financial services sectors.
-
Technical Excellence
We have a well-established specialized technical division, with in-depth, local and international knowledge and experience, which consists of three units namely; Accounting, Audit and Sustainability reporting.
-
Corporate Tax
We offer your business access to a global network of tax specialists in over 130 countries with extensive corporate tax technical skills to provide meaningful advice and adding value to your organization.
-
Value-Added Tax
We can manage your overall exposure to indirect taxes, guide you through complex South African Value-Added Tax (VAT) legislation.
-
Global Mobility
Taxes can be complicated, but the SNG Grant Thornton approach is to assist the new assignee with a clear and easy process.
-
Customs and Excise Tax
Our Customs and Excise team assist traders with driving cost-effective supply chains while maintaining legitimate trade.
-
Tax Technology
This is the lynchpin of our tax audit and advisory approach in making the tax function of our clients effective in data management tools.
-
International Tax & Transfer Pricing
Our team is ideally suited to serve large multinationals and other global companies that need on the ground expertise in multiple jurisdictions, given our extensive network of offices around the globe.
-
Specific Focus Areas
We have a team of dedicated tax specialists with deep knowledge to bring practical and cost-effective tax solutions to our clients and assist entities operating within these sectors to effectively manage their tax needs.
-
Tax Dispute Resolution (TDR) Services
Taxpayers are experiencing significant increase in number and size of tax audits by SARS which are leaving taxpayers with additional assessments and penalties, sources of tax disputes.
-
Business Consulting
We provide fit-for-purpose solutions to address major challenges the Education sector faces by supporting our clients.
-
Employees’ Tax Services
Its important to ensure that the institution complies with the tax legislation and that all payroll records are accurate and complete.
-
Programme Assurance & Advisory
The need for sound project management and effective solution delivery gives you the edge in competitive markets.
-
Forensic Services
Fraud detection review and forensic investigation for Higher Education
-
Digital and Analytics
The digitalisation of processes within the higher education sector leads to increased data generation. This data can be an essential asset when leveraged correctly.
-
Cyber Security Services
There is no one-size-fits-all security solution to preventing all attacks, but we have cybersecurity strategies that education institutions can use to minimise cyber threats.

-
Sustainable Development Goals (SGDs)
SDG Impact Standards Training Course
- South Africa
- Grant Thornton Morocco
- Grant Thornton Namibia
- Grant Thornton Malawi
- Grant Thornton Gabon
- Grant Thornton Algeria
- Grant Thornton Togo
- Grant Thornton Côte d'Ivoire
- Grant Thornton Zimbabwe
- Grant Thornton Cameroon
- Grant Thornton Zambia
- Grant Thornton Botswana
- Grant Thornton Mauritius
- Grant Thornton Senegal
- Grant Thornton Uganda
- Grant Thornton Nigeria
- Grant Thornton Kenya

In this issue, we compare tariffs by top traded products between South Africa, United States of America, China our biggest trading partner for 2023 and 2024, Germany, Russia, Nigeria,
Botswana, Mozambique and Namibia.
It is important to note that while we compare tariffs in reference to volume of trade, trade between countries is not influenced only by tariffs. Investment in specific areas of interest with mutual benefits, economic growth for one party may benefit a trading partner, closer political tiers etc. (non-tariffs trade enablers/barriers).
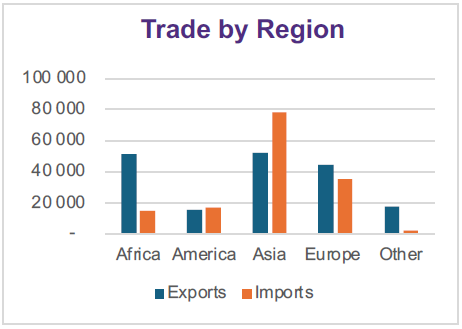
Africa is the biggest market for South African Exports followed by Asia, Europe and America. We unpack below the tariffs imposed on South African products by some of the leading trading partners within these regions.
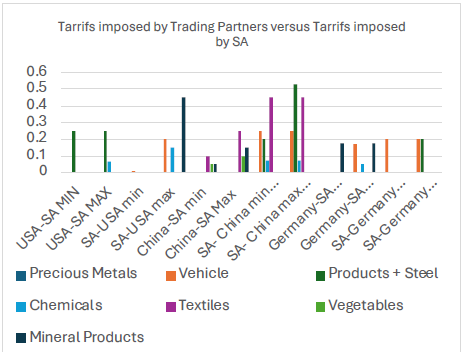
The tariffs below are recorded from min to maximum. This is because levying of tariffs involves different tariff headings from different chapters and sections of the harmonized
schedule making it very difficult to list exact tariffs charged by one trading partner to another. The comparisons below exclude antidumping duties and counter bailing duties.
Certain products belonging to the same product groups can be found in different chapters with different tariff rates being applied (i.e. machinery, depending on composition, product description, and use). Due to limited information available on the exact tariffs charged by each party on products exported and imported we have used the minimum and maximum rates.
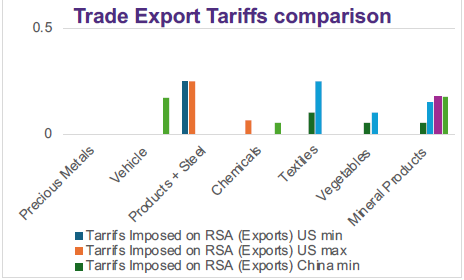
Comments on the Trade Exports Tariffs Comparison Graph:
In general, South Africa imposes higher tariffs than those imposed by trading partners outside of Africa, with highest tariffs imposed on certain steel products imported from China.
South Africa imposes tariffs of 20% on medium to heavy commercial vehicles and 25% on light vehicles imported from America. America does not impose tariffs on South African imported vehicles as these are covered by the African Growth and Opportunity Act trade agreement (AGOA).
Below graph depicts South Africa penetration into global markets with top 10 commodities & consumption by country/region;
South Africa’s primary import partner for various goods remains China. China dominates the import of steel and iron making 52% of South Africa import market and textiles making up 45% of South Africa import market. The higher tariffs charged on Chinese tariffs at 45% (minimum) and 52% (maximum) has not impacted the amount of textiles imported by South African Business or Individuals from China.
Germany is a key supplier of motor vehicles and parts making up 40% (25% tariffs imposed by South Africa) of the import market in South Africa, America makes up 20% (20% tariffs imposed by South Africa) of the import market and China makes 25% ( 25% tariffs imposed by South Africa).
Based on this, tariffs alone can therefore not explain why South Africans are buying less American cars in comparison to German cars or Chinese cars.
Top 10 SA Exports
- Mineral products: Rest of World-ROW @31.6% of R512B, followed by China @28.7%, India @12.5%, Germany @3.26%, & USA@2%.
- Precious Metal: ROW leads @76.8% of R377B, USA 2nd @14.6%, Germany @6%, & China @1.4%.
- Vehicles, aircraft & Vessels: ROW sits top @38% of R276B, Germany 2nd @31.9%, USA @ 12.6%, & India @ 1.9%.
- Products Iron & Steel: ROW sits top @ 35.5% of R207B, China 2nd @ 20.3%, USA @ 10.5%, India @ 1.6%, & Germany @ 1.1%.
- Machinery: ROW leads @ 22.8% of R146B, Germany @ 7.9%, USA @ 6.2%, China @ 0.7%, & India @ 0.6%.
- Vegetables: ROM consumed 57% of R136B, China 2nd @ 5.8%, USA @3.6%, Germany @2.1%, & India @ 1.3%.
- Chemicals: ROM sits top @ 34.6% of R117B, USA @ 8.6%, Germany @ 3.3%, China @ 2.6%, & India @ 2.2%.
- Prepared foodstuffs: ROW tops @ 30.3% of R86.7B, USA 2nd @ 4.9%, Germany @ 2%, China @ 0.9%, & India @ 0.3%.
- Plastic rubber: ROW consumed 18.3% of R35.2B, USA @ 3%, Germany @1.1%, China @0.6%, & India @ 0.4%.
- Wood pulp & paper: India consumed @ 27.7%, China @ 17.1%, ROW @16.5%, USA @ 2%, & Germany @ 0.5%.
Digest & Conspectus, and Contact details
Customs environment (import/export) involves lot of administrative compliance, global trade research and frequent updates, regular updates are required to ensure seamless and cost-effective value chain activities. At SNG Grant Thornton, we offer a detailed health check for cross-border activities compliance status and savings your entity can have through evaluating core areas/topics such as “Trade Agreements & Rules of Origin” etc.